
Every September, we sit down and look at the whole country. Not just LA. Not just California. Because a lot of our borrowers own property in more than one state now, and lenders price every market a little differently. So here’s the 2026 version. A national U.S. commercial mortgage market analysis, and the three metros that are, by the numbers, the hottest commercial mortgage markets in 2026.
Short version. The money is flowing again. But the Fed just hiked for the first time since 2023, and the 10-Year Treasury is sitting at 5%. Strong demand for loans, and expensive loans. Let’s get into it.

Where the U.S. Commercial Mortgage Market Stands in September 2026
Start with the benchmarks, because every quote you get this month is built on top of them.
| Benchmark | Level (week of Sept 21, 2026) | What happened |
|---|---|---|
| Fed Funds Target | 3.75% – 4.00% | Raised 25 bps on Sept 16. First hike since 2023. Unanimous vote. |
| 10-Year Treasury | ≈ 5.01% | Touched 5.04% mid-week, highest since 2007. Up a full point since February. |
| SOFR (overnight) | 3.85% | Floating rate bridge and construction loans price off this. |
| Prime Rate | 7.00% | Moved up with the Fed. SBA 7(a) variable loans follow it. |
The 10-Year is what hurts. It was under 4% back in February. Fixed-rate permanent loans price off it, so a life company or CMBS quote that was 6.25% in the spring is closer to 7.25% today, all else equal. The Fed statement said inflation “remains elevated” and 12 of 18 participants penciled in one more hike before year-end. Nobody should be underwriting a rate cut into their 2027 refinance. You can watch the daily numbers on the Federal Reserve’s H.15 release.
And yet. Borrowing volume is up. A lot.
Originations: Up 16% and Climbing
The Mortgage Bankers Association’s second-quarter survey showed commercial and multifamily originations 16% higher than a year ago and 12% higher than Q1. Michael finds the mix interesting. Office lending up 47%. Retail up 61%. CMBS lenders up 68% year over year and 55% in a single quarter. Banks up 61%. Agencies were down 17% and life companies down 27%, because everyone else came back into the pool and undercut them. MBA’s full-year forecast is $805 billion, a 27% jump over 2025 and the most since 2022.
Lending Terms: Tighter Spreads, Lower Leverage
CBRE’s Lending Momentum Index for Q2 shows what the loans actually look like. Commercial spreads compressed to 204 basis points, 21 tighter than a year ago. Multifamily 162. But leverage came down: commercial LTV averaged 59.6%, multifamily 63.3%, debt service coverage 1.43x, debt yield 10.2%. Lenders are competing on price, not on proceeds. Debt funds took 38% of the non-agency market, banks 30%, life companies 21%, CMBS 11%.
The Maturity Wall Is Still a Wall
$875 billion of commercial and multifamily debt matures in 2026. That’s 17% of the $5 trillion outstanding. Down from $957 billion last year, but a lot of that is extensions getting pushed forward, not loans getting paid off.
Distress and Recovery at the Same Time
Trepp reported a CMBS delinquency rate of 7.85% in August. About $47 billion of loans were 30+ days late, with office around 42% of it. Special servicing hit 11.42%, highest since February 2013. So here’s the picture: lenders are lending hard on good assets in good markets, and letting the rest work through the system. Both things are true.
How Michael Picked the Three Hottest Markets
Not population growth. Not a “best places to live” list. Four things a lender actually underwrites:
- Leasing momentum and absorption. Is the income going up?
- Investment sales volume. Where buyers go, lenders follow.
- Lender appetite. Are big loans getting done, and at what spread?
- Vacancy direction. Not the level. The direction.
That produces Dallas-Fort Worth, Manhattan, and the San Francisco Bay Area. Two of the three would have been on nobody’s list two years ago. That’s how fast this turned.
#1 Dallas-Fort Worth: The Volume Market
DFW is the one everybody agrees on. The whole industry ranks it first for 2026 investment, and the numbers back it up across every property type.
Industrial. 9.9 million square feet of net absorption in Q2 alone, up 61.6% from a year ago. Vacancy 8.3%, down 60 basis points. 24 million square feet under construction, and the market is still absorbing it. Manufacturing users, not just warehouses, took 30% of the 100,000-square-foot-plus leases in the first half. That’s reshoring showing up in a lease report.
Office. Vacancy 25.0%, which sounds bad until you see it’s down 150 basis points year over year. Absorption swung to positive 939,000 square feet in Q2 after a negative Q1. Asking rents are $34.79, up 6.5%. Office sales by square footage up 54% year to date per Kidder Mathews. One of a handful of metros where office demand is actually positive.
Multifamily. The complicated one. Occupancy 93.8%. Effective rents down about 2.8% year over year, but they posted the first quarterly gain in over a year. Somewhere between 30,000 and 43,000 units under construction depending on who’s counting, though starts are down 21%. Sales volume jumped to $2.27 billion in Q2 from $1.33 billion in Q1. And over $2 billion of DFW apartment loans mature in the second half of 2026, and another $3.1 billion in the first half of 2027.
Why lenders love it: no state income tax, roughly 100 corporate headquarters relocations since 2018, 8.3 million people, and an economy not dependent on any one industry. The agencies, with $88 billion of cap room each for 2026, are all over DFW multifamily. Banks and debt funds are fighting over the industrial.
What Michael tells borrowers: DFW multifamily is a refinance market right now, not a rent growth market. Underwrite flat rents. That maturity wall means a lot of bridge-to-agency executions over the next 12 months.
#2 New York City: The Big Loan Market
Manhattan is back and it’s not close. CBRE counted 7.88 million square feet of office leasing in Q2, 24% above the five-year average, and 14.9 million year to date. Colliers uses a different methodology and has the first half at roughly 23 million square feet, the strongest since 2002. Either way. Availability is 14.4%, down 310 basis points in a year. Asking rents $80.17, up 4%. Park Avenue trophy space quoting $119 and up. AI tenants alone took 800,000 square feet in Q2.
Investment sales. Ariel Property Advisors had Manhattan at $9.87 billion in the first half, up 50% year over year. Office $3.53 billion (+31%). Multifamily $2.34 billion (+93%). Hotels more than doubled.
The lending is where NYC really separates. Through early August, there was $18.3 billion of private-label office CMBS issued nationally, up 25%. Fourteen New York single-asset loans made up 60% of that entire national total. Two Manhattan West got $1.9 billion for ten years in May at a 5.53% coupon, 107 basis points over the Treasury. Nine West 57th took $1.8 billion. Those are pre-hike coupons, though. Same deal today prices 60 to 80 basis points wider on the Treasury move alone.
The other side of the ledger is real too. Worldwide Plaza’s $940 million loan went into receivership. Trophy versus everything else. Lenders are underwriting the building, not the city.
What Michael tells borrowers: if you own Class A, leased-up Manhattan, you have more lender options than any time since 2019. Class B with rollover risk, you’re talking to debt funds at 9% plus, or you’re having a workout conversation. Not much in between.
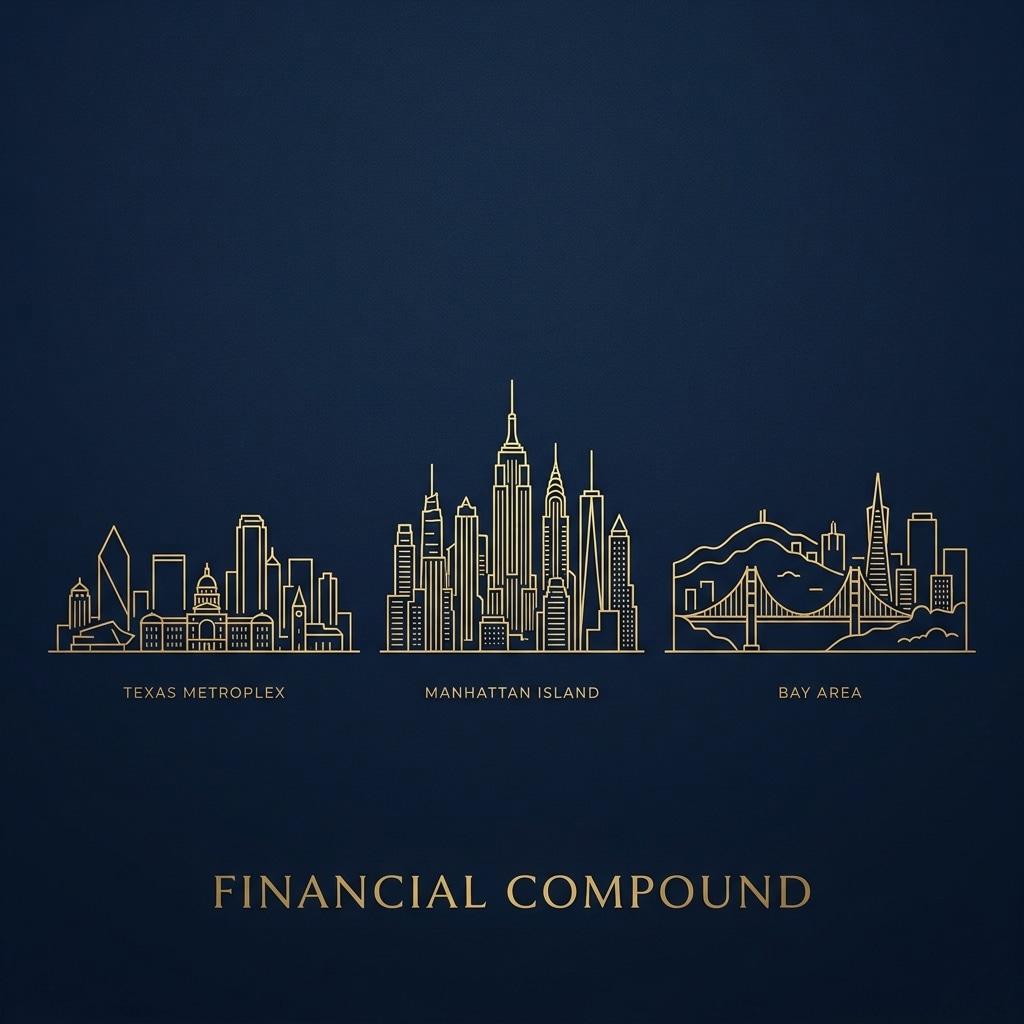
#3 San Francisco Bay Area: The Comeback Market
This is the one Michael gets the most pushback on. “San Francisco? With 30% office vacancy?” Yes. 30.1%. And that’s down 360 basis points in twelve months, the lowest since Q3 2023. Remember rule number four. Direction, not level.
Office. Positive 1.0 million square feet of absorption in Q2, 2.2 million for the first half. Sublease inventory down to 3.5 million square feet, lowest since early 2020. Active tenant requirements: 8.6 million square feet versus 5.7 million a year ago. Asking rents are $70.31 and $76.60 for CBD Class A. Tech and AI companies leased over 14 million square feet across San Francisco and Silicon Valley in 2025, 55% of all activity, and there’s more than 5 million square feet of AI requirements in the market right now.
Multifamily is the quiet story. Bay Area apartment vacancy is 4.3%, the lowest since 2013. Average rent is $2,921, up 7.7%. San Francisco County: $3,650, up 15.7%. Only 663 units delivered in Q2, also the lowest since 2013, with about 18,500 under construction for a metro of 7.7 million people. Supply cannot keep up. That’s a lender’s dream, and every apartment lender Michael talks to knows it.
Capital markets. CBRE named San Francisco among the strongest investment markets in Q2 alongside New York and Los Angeles. One De Haro traded at $103 million, $814 a foot, in July. Distress remains: 747 Front Street’s debt changed hands for around $49 million via deed-in-lieu this month. But that’s what a basis reset looks like.
What Michael tells borrowers: Bay Area apartments are the easiest loan in California right now. Agency, bank, life company- they all want it. Office is a different animal. Buying at a reset basis with a bridge loan and a three-year business plan is the trade of the cycle for people with the stomach for it. We have closed Bay Area office workouts and acquisition bridge loans in the same month.
Honorable Mentions
South Florida, where retail availability is under 4%. Phoenix, Houston, Nashville, and Charlotte. They didn’t make Michaels top three because either absorption isn’t there yet or, in Sun Belt apartment markets, new supply is still heavier than demand. Give them a year.
The Three Markets Side by Side
| Metro | Hottest Sector | Headline Stat (Q2 2026) | Watch Out For | Best Loan Fit |
|---|---|---|---|---|
| Dallas-Fort Worth | Industrial, office recovery | 9.9M sf industrial absorption, +61.6% | Apartment supply; $2B+ multifamily maturities in H2 | Agency multifamily; bank / debt fund industrial |
| New York City | Trophy office | $9.87B H1 sales, +50% | Class B office distress | SASB CMBS; life company |
| SF Bay Area | Multifamily, AI-driven office | 4.3% apartment vacancy, lowest since 2013 | 30% office vacancy (falling) | Agency / bank apartments; bridge for office |

What Today’s Commercial Mortgage Rates Look Like by Loan Type
Indicative ranges for the week of September 21, 2026. These move daily with the Treasury; your quote depends on leverage, market, asset and sponsor.
| Loan Type | Indicative Rate Range | Notes |
|---|---|---|
| Agency Multifamily (Fannie Mae / Freddie Mac) | 6.10% – 6.45% | Still the cheapest fixed-rate money for stabilized apartments |
| Bank (apartments) | 6.30% – 7.00% | Relationship pricing; deposits help |
| Life Company | 6.35% – 7.25% | Best at 65% LTV or under, quality assets |
| CMBS | 6.85% – 7.90% | Higher leverage, cash-out friendly; prepay is the tradeoff |
| Bridge / Debt Fund | 8.00% – 11.00% | SOFR + 400 to 700; transitional assets |
| SBA 504 | 6.55% – 6.75% | Owner-user; 20- and 25-year fixed debentures |
What This Means If You’re Borrowing in California
Financial Compound is in Santa Monica. We’ve been doing this since 1996 and have placed over $6 billion in commercial debt and equity, borrowers only, no upfront fees. So why is Michael writing about Dallas and New York?
Because the same lenders chasing DFW industrial and Manhattan trophy office are the ones we call for Los Angeles, the Inland Empire and San Diego. When lenders compete hard in the hot markets, spreads tighten everywhere. That 21 basis point compression in Q2 is real, even with the Treasury up a full point. A good asset in a good California submarket is getting quotes right now that would have been impossible in 2024.
Three moves for the fourth quarter:
- If your loan matures in the next 18 months, start now. When the 10-Year moves 10 basis points a day, the rate lock window is everything.
- Consider bridge-to-agency on multifamily. Stabilize on a floating rate bridge, then take out with Fannie or Freddie once rents settle.
- Don’t wait for rate cuts. The Fed just told you they’re not coming this year. Underwrite today’s rate. If it gets better, refinance.
Frequently Asked Questions
What are the hottest commercial real estate markets in the U.S. in 2026?
Based on Q2 2026 absorption, investment sales and lender activity, the three hottest commercial mortgage markets are Dallas-Fort Worth (industrial and office recovery), New York City (trophy office and record CMBS issuance) and the San Francisco Bay Area (AI-driven office leasing and the tightest apartment market since 2013). South Florida, Phoenix, Houston, Nashville and Charlotte are the next tier.
Are commercial mortgage rates going up or down in late 2026?
Up. The Federal Reserve raised the fed funds rate to 3.75%–4.00% on September 16, 2026, its first hike since 2023, and signaled another before year end. The 10-Year Treasury is near 5.0%. Fixed rate commercial mortgage quotes run roughly 6.1% to 7.9% depending on loan type, with bridge debt at 8% and above.
Is it a good time to refinance a commercial property?
If your loan matures before mid-2027, yes, start now. With $875 billion of commercial debt maturing in 2026 and the Fed signaling more hikes, waiting for a better rate is a bet against the Fed’s own guidance. Spreads are the tightest in years, which partially offsets the higher Treasury.
Which commercial loan types are most active right now?
CMBS lending was up 68% year over year in Q2 2026 and bank lending up 61%, per the MBA. Debt funds hold about 38% of the non-agency market. Agency multifamily (Fannie Mae and Freddie Mac) remains the cheapest fixed-rate execution for stabilized apartments.
Can a California commercial mortgage broker arrange a loan on a property in Texas or New York?
Yes. Financial Compound arranges commercial real estate financing nationally. Agencies, life companies, CMBS conduits, debt funds and national banks lend in all 50 states, and a borrower-exclusive broker’s lender relationships travel with the borrower wherever the property is.