
Data current as of September 26, 2026. Covers Los Angeles County, Orange County, and the Inland Empire (Riverside and San Bernardino Counties).
The Fed raised rates on September 16. First hike since 2023. Nine days later, the 10-year Treasury closed at 5.17%, the highest level since 2007. That’s the backdrop for the Los Angeles commercial real estate market in Q4 2026, and it changes the math on almost every loan request crossing my desk right now.
Financial Compound has been placing commercial debt out of Santa Monica since 1996. Here’s my read of where LA County, Orange County, and the Inland Empire stand after the second-quarter brokerage reports, what the rate shock means for owners and buyers, and what I expect between now and December 31. Numbers first. Opinions after.
Rate Snapshot: What LA Borrowers Are Pricing Against
Every commercial loan in Southern California gets priced off a handful of benchmarks. As of this week, they look like this:
| Benchmark | Level | As of |
|---|---|---|
| Federal funds target range | 3.75%–4.00% | Sept 17, 2026 |
| WSJ Prime Rate | 7.00% | Sept 17, 2026 |
| SOFR (overnight) | 3.88% | Sept 24, 2026 |
| 2-Year Treasury | 4.81% | Sept 25, 2026 |
| 10-Year Treasury | 5.17% | Sept 25, 2026 |
The FOMC voted 12–0 to raise the target range a quarter point, citing inflation that remains elevated as oil prices climb amid the Iran conflict. You can read the reasoning in the Fed’s September 16 statement. The new dot plot shows 12 of 18 participants expecting one more quarter-point move before year-end, and futures traders were putting the odds of an October 28 hike at roughly 70%. We check every benchmark against the Federal Reserve’s H.15 release before publishing, and you should re-check them before you lock anything.
Indicative Commercial Mortgage Rate Ranges, Late September 2026
Here’s what those benchmarks translate to for a stabilized, well-sponsored Los Angeles deal. These are indicative ranges, not quotes. Your rate depends on leverage, DSCR, sponsorship and property type.
| Loan type | Indicative rate | Pricing basis |
|---|---|---|
| Agency multifamily (Fannie Mae / Freddie Mac), 5–10 yr fixed | 6.40%–7.10% | Treasury + spread |
| Bank permanent, 5-yr fixed | 6.75%–7.75% | Treasury or swap + spread |
| CMBS / life company, 10-yr fixed | 6.60%–7.60% | 10-yr Treasury + spread |
| Bridge, floating | 7.35%–9.40% | Term SOFR + 350–550 bps |
| Construction | 8.00%–10.00% | Prime or SOFR based |
| Hard money | 10.00%–12.50% | Fixed, 1–2 yr terms |
Notice the problem. Alot of LA apartment and industrial product is trading around a 5.8% cap rate, which sits below most of these coupons. Negative leverage is back. That one fact drives most of my Q4 forecast below.
Los Angeles Office Market: Two Markets Wearing One Name
Direct office vacancy in Los Angeles hit 16.4% in Q2 2026 according to the Kidder Mathews Q2 report, up from 16.0% the prior quarter and 15.8% a year ago. Add sublease space and total vacancy runs 17.8%. Direct asking rents sat at $3.50 per square foot per month, full service, unchanged for a year, with Class A at $3.75. Colliers, which measures a broader inventory, puts countywide vacancy at 25.6%. Different yardsticks, same direction. Compare trends, not headline levels, when you read these reports.
The spread between submarkets is the real story. Southeast LA posted 5.6% direct vacancy while Miracle Mile hit 28.6%. On the Westside, Colliers has West LA vacancy flat at 24.6%, but roughly one-third of Santa Monica inventory is available for lease after tech and media pullbacks. PwC left Downtown for Century City, and inside Downtown the CBD core keeps tightening while the fringe lags.
Trophy capital hasn’t gone anywhere. Douglas Emmett bought the Bedford Collection in West LA for $260 million, about $1,085 per square foot. Commodity Class B is a different planet. Those buildings are financeable today mostly through bridge and debt fund capital at low leverage, or through a commercial loan workout when the existing loan is underwater.
One encouraging sign. Sublease availability has fallen to roughly 6.7 million square feet, well off the 11 million square foot peak in 2024. Sublease space clearing is usually the first sign of a floor.
Los Angeles Industrial Market: The Floor Is Forming, Rents Haven’t Caught Up
LA industrial just had its best demand quarter in years. Savills recorded 4.0 million square feet of net absorption in Q2, the highest quarterly total since 2021, pushing vacancy down 40 basis points to 6.8%. Big move-ins included Valar Atomics taking 512,500 square feet in Torrance and Amazon taking 504,800 square feet in Long Beach. CBRE, on its own basis, shows vacancy at 5.0% after a third straight quarter of positive absorption.
Rents are the lagging indicator. CBRE has asking rents down 7.0% year over year and 32.4% over the past 36 months. Kidder Mathews pegs the average direct ask at $1.37 per square foot NNN. The development pipeline has shrunk to about 3.1 million square feet, roughly 40% preleased, so new supply isn’t the threat it was in 2024.
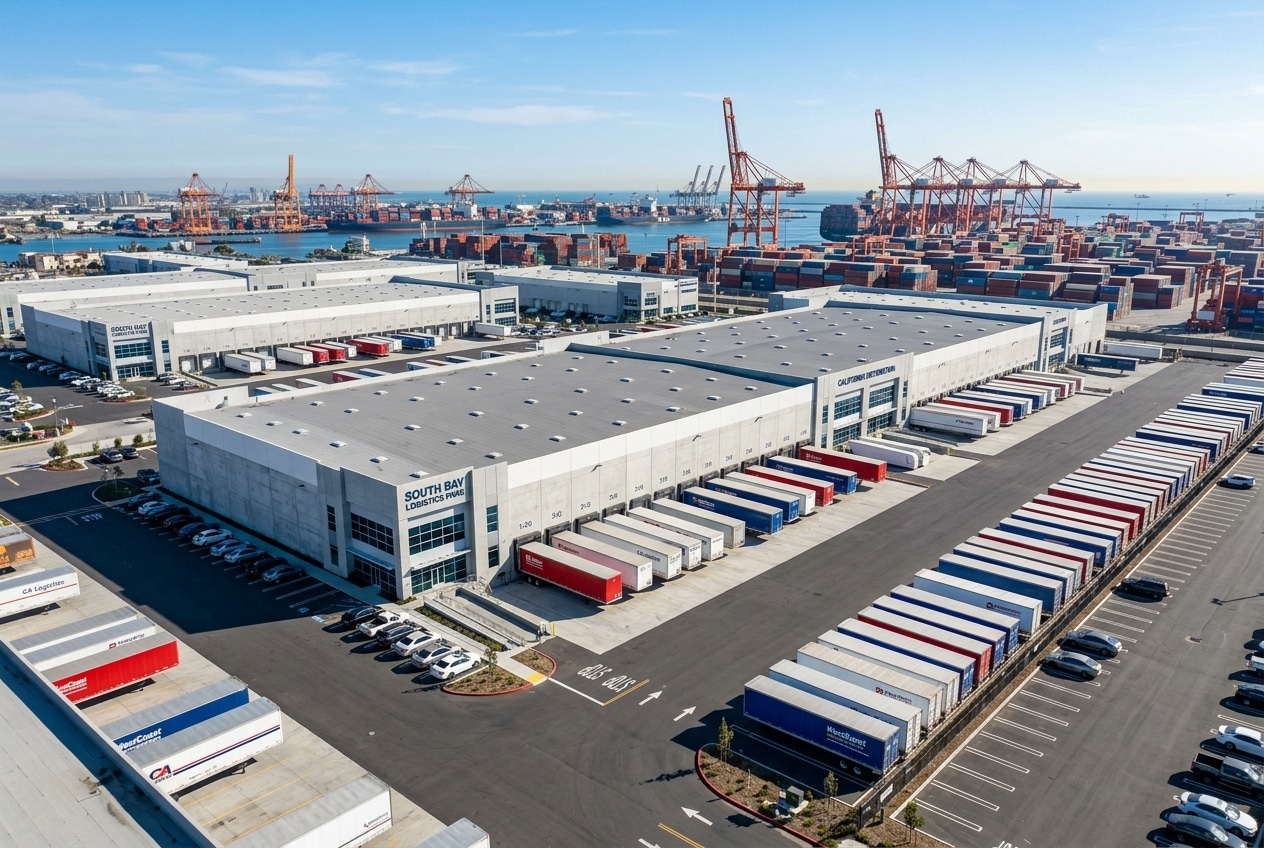
The ports back this up. The Port of Los Angeles moved more than 2.9 million TEUs from June through August, its busiest three-month stretch on record, and year-to-date volume through August was just over 7 million TEUs, up 1.5%, according to the port’s August cargo release.
The financing catch. An industrial building leased in 2022 is probably rolling to a lower rent. Lenders size on in-place and mark-to-market NOI, so owners planning a commercial mortgage refinance in the next year should model the rollover before they talk to a bank.
Multifamily: LA Keeps Building and Vacancy Keeps Holding
Los Angeles is doing something most apartment markets aren’t. It’s delivering. Trailing 12-month completions hit 9,105 units per Matthews, on pace for the biggest year since 2000, yet vacancy held at 4.52% and effective rent rose 0.8% to $2,887. Kidder Mathews, on a CoStar basis, shows 5.5% vacancy and an average ask of $2,310, with the construction pipeline down 15.4% year over year.
Two policy items matter for Q4. First, the City of LA’s RSO formula changed July 1, 2026. Allowable increases are now 90% of CPI with a 1% floor and a 4% cap, which squeezes NOI growth on roughly 650,000 rent-stabilized units. Second, Measure ULA thresholds adjusted for sales closing after June 30, 2026: 4% on sales above $5.4 million and 5.5% at $10.9 million and up, applied to the full price, per the City of Los Angeles Office of Finance. The statewide initiative that would have gutted ULA was pulled from the November ballot in June after a deal in Sacramento, so assume ULA stays put.
The effect shows up in the deal data. Buyers crowd under the threshold and bigger assets sit. For owners who need to hold rather than sell, apartment loans and multifamily financing through Fannie Mae and Freddie Mac are still the cheapest long-term debt available, even at today’s Treasury levels.
Retail: Vacancy at a Decade High, Buyers Still Showing Up
LA retail vacancy reached 5.83% in Q2 per Matthews, the highest in more than a decade. Kidder Mathews has it at 5.6% with average asks around $2.76 per square foot NNN. And yet sales volume jumped more than 40% year over year to $4.9 billion. Why? Almost nothing new is being built (the pipeline is about 0.1% of inventory), and grocery-anchored centers remain the most financeable retail in the country. Financial Compound closed a $16,050,000 grocery store refinance in LA at 40% LTV and 2.4 DSCR for exactly that reason. The 2028 Olympics and wildfire rebuilding give landlords a longer runway than the vacancy number suggests.
Surrounding Counties: Inland Empire and Orange County
Inland Empire Industrial Market 2026
The Inland Empire posted its first real improvement in over a year. Colliers shows vacancy down 30 basis points to 7.8%, with 3.1 million square feet of positive absorption reversing a negative 3.6 million in Q1. Gross leasing hit 16.7 million square feet, a quarterly record. Cushman & Wakefield, using a different basis, reports 8.8% vacancy and cumulative occupancy losses of 3.8 million square feet through midyear, so dont read the recovery as finished.
Rents tell you who has leverage. The average ask slipped to $0.99 per square foot NNN, the first sub-$1.00 reading since Q3 2021. CBRE splits the region: IE West at 5.9% vacancy and IE East at 9.0%, with 6.2 million square feet under construction. Industrial outdoor storage is the exception, with yard rents still climbing on account of AB 98 making new yards harder to entitle. If you are financing in Riverside or San Bernardino County, our Inland Empire team works these submarkets every week.
Orange County Office and Industrial
Orange County office is the steadiest story in the region. Direct vacancy held at 10.9% in Q2, down from 12.0% a year earlier, and full-service asking rents climbed 4.3% to $2.94 per square foot. Tustin sits at 0.6% vacancy while The City submarket runs 22.3%. OC industrial vacancy is 5.2% per Cushman & Wakefield, and Colliers logged its first quarterly improvement since late 2022.
Credit Conditions: Where the Stress Actually Is
Distress hasnt peaked. The Trepp CMBS delinquency rate was 7.85% in August, after a 51 basis point jump in July driven by large matured balloon loans. The special servicing rate climbed to 11.42%, the highest since February 2013, pushed up by office, retail and lodging. Multifamily CMBS delinquency held at 7.69%.
This is the maturity wall. Loans written between 2016 and 2021 at 3% to 4% are coming due into 6.5% to 7.5% money, and many of them simply don’t size. That’s where a commercial loan modification, a lender extension, or a commercial bridge loan buys time.
Q4 2026 Outlook: Financial Compound’s Sector-by-Sector Analysis
Our base case: the Fed hikes once more by December, the 10-year trades between 4.90% and 5.40%, Southern California avoids recession, and port volume eases seasonally in October and November after retailers pulled holiday inventory forward. On that basis, heres what I expect by December 31. Each forecast uses the same source’s methodology as its Q2 figure, so the comparison is apples to apples.
| Metric (source basis) | Q2 2026 actual | Q4 2026 forecast | Direction |
|---|---|---|---|
| LA office direct vacancy (Kidder Mathews) | 16.4% | 16.4%–16.9% | Flat to weaker |
| LA office direct asking rent, FS/mo (Kidder Mathews) | $3.50 | $3.45–$3.52 | Flat, concessions rising |
| LA industrial vacancy (Savills) | 6.8% | 6.3%–6.8% | Improving |
| LA industrial asking rent, YoY change (CBRE) | −7.0% | −3% to −5% | Declines narrowing |
| LA multifamily vacancy (Matthews) | 4.52% | 4.4%–4.7% | Stable |
| LA retail vacancy (Kidder Mathews) | 5.6% | 5.5%–5.9% | Stable |
| Inland Empire industrial vacancy (Colliers) | 7.8% | 7.3%–7.9% | Slowly improving |
| Orange County office direct vacancy (Kidder Mathews) | 10.9% | 10.6%–11.2% | Stable |
| LA multifamily and industrial cap rates | ~5.8% | +15 to +35 bps | Rising |
1. Cap Rates Reprice Up, Again
The 10-year is up about a full point from its February low. Cap rates haven’t fully followed. I expect multifamily and industrial cap rates to drift up 15 to 35 basis points by year-end, with the biggest adjustment on deals that need leverage to pencil. In Q4, cash buyers or low-leverage buyers set the price.
2. The Refinance Gap Widens and Bridge Demand Rises
Owners who were waiting for rates to come down just got the opposite. Expect more short-term bridge loans, more lender extensions, and more discounted payoff negotiations on office, especially Class B product on the Westside and the Downtown fringe.
3. Industrial Is the Bright Spot, Rents Are the Last to Turn
Vacancy should keep improving in LA and the IE as record leasing converts to move-ins. Rents probably don’t bottom until early 2027, but year-over-year declines should narrow into the negative 3% to 5% range. Infill South Bay, Central, and Mid-Counties product stays tightest.
4. Office Bifurcation Continues
Trophy and Class A space in Century City and the DTLA core keeps taking share. Commodity B and C product keeps losing it, and adaptive reuse (schools, residential, medical) becomes the exit for more of those buildings. Medical office stays financeable.
5. Deals Migrate Below $5.4 Million and Outside City Limits
With ULA locked in, City of LA sales cluster below the threshold and buyers pay up for comparable assets in Burbank, Glendale, Long Beach and other cities outside LA city limits. Watch Santa Monica and Culver City too. Both have their own elevated transfer taxes.
Bull Case and Bear Case
Bull case: a US-Iran agreement to reopen the Strait of Hormuz knocks oil lower, the 10-year falls back toward 4.60%–4.80%, and the Fed pauses. A refinance window opens in December and fixed-rate volume jumps. Bear case: the 10-year pushes past 5.50%, the Fed hikes in both October and December, and maturity defaults accelerate into Q1 2027, especially office and older multifamily with thin coverage.
What LA Borrowers Should Do Before Year-End
- If your loan matures in the next 12 months, start now. Lenders get slower and pickier when rates move this fast.
- Consider a shorter fixed term (3 to 5 years) with flexible prepayment instead of locking in 10 years with Treasuries at a 19-year high.
- On floating-rate debt, price a rate cap or swap before the October 28 FOMC meeting.
- Model Measure ULA into any City of LA sale before you set an asking price.
- Industrial owners: underwrite lease rollover to today’s market rent, not the 2022 rent.
- If a refinance won’t size, talk to your servicer about an extension early. Waiting shrinks your options.
Frequently Asked Questions: Los Angeles Commercial Real Estate Market Q4 2026
What is the Los Angeles office vacancy rate in 2026?
Direct office vacancy in Los Angeles was 16.4% in Q2 2026 according to Kidder Mathews, with total vacancy including sublease space at 17.8%. Colliers, which measures a broader inventory, reported 25.6%. Submarkets range from about 5.6% in Southeast LA to 28.6% in Miracle Mile.
Are Los Angeles industrial rents still falling?
Yes, but more slowly. CBRE reported LA industrial asking rents down 7.0% year over year in Q2 2026 and 32.4% over three years. Vacancy is improving, so Financial Compound expects the year-over-year decline to narrow to roughly 3% to 5% by Q4 2026.
What are commercial mortgage rates in Los Angeles right now?
As of late September 2026, indicative ranges run about 6.40%–7.10% for agency multifamily, 6.60%–7.60% for 10-year CMBS or life company debt, 7.35%–9.40% for floating-rate bridge loans, and 10%–12.5% for hard money. The 10-year Treasury was 5.17%, SOFR was 3.88%, and the Prime Rate was 7.00%.
What are the Measure ULA thresholds for 2026?
For City of Los Angeles sales closing after June 30, 2026, Measure ULA is 4% on sales above $5.4 million and 5.5% on sales of $10.9 million or more, applied to the full sale price. It is charged on top of the standard city and county transfer taxes.
Is the Inland Empire industrial market recovering?
Early signs, yes. Colliers reported Inland Empire industrial vacancy down to 7.8% with 3.1 million square feet of positive absorption and record gross leasing in Q2 2026. Average asking rent, however, fell below $1.00 per square foot NNN for the first time since 2021.
Will Los Angeles commercial property values fall in Q4 2026?
For leveraged buyers, modestly. With the 10-year Treasury above 5%, Financial Compound expects multifamily and industrial cap rates to rise 15 to 35 basis points by year-end, which pressures values unless NOI grows. Trophy office and grocery-anchored retail should hold up best.
Talk to Financial Compound About Your Q4 Financing
Financial Compound has placed over $6 billion in commercial debt and equity since 1996. We represent borrowers only and never charge upfront fees. Call Michael at (310) 260-5900 x3, email info@commercialmortgagebroker.org, or book a consultation online.