
Data current as of October 22, 2026. Covers the greater Sacramento region: Sacramento, Placer, El Dorado, and Yolo Counties. Rates move weekly, so re-check them before you sign anything.
On July 1, California called most of its state workforce back to the office four days a week. In the first ten days, downtown foot traffic ran 12% ahead of the same stretch last year, according to the Downtown Sacramento Partnership. Three months later, the office vacancy number didn’t move. Not up. Not down. Flat.
That tells you a lot about the Sacramento commercial real estate market in 2026. It isn’t Los Angeles, and it isn’t San Francisco. It’s a government town that quietly turned into a distribution town, a healthcare town, and a place Bay Area renters move to when they’ve had enough. Each of those stories is moving at its own speed, and lenders are pricing each one differently.
Financial Compound has been placing commercial debt out of Santa Monica since 1996. We cover Northern California commercial financing week in and week out, and Sacramento files keep landing on Michael’s desk. So heres the full read: office, industrial, multifamily, and retail, what the numbers say, and what a lender will actually do with your deal.
The Rate Backdrop Sacramento Borrowers Are Pricing Against
Before any of the local numbers matter, you have to know what money costs. The Fed raised its target range on September 16, the first hike since 2023. The 10-year Treasury kept climbing after that, closing at 5.31% on October 5, and it’s backed off only a little since. You can track the daily numbers on the Federal Reserve’s H.15 release.
| Benchmark | Level | As of |
|---|---|---|
| Fed funds target range | 3.75%–4.00% | Raised September 16, 2026 |
| SOFR (overnight) | 3.88% | October 20, 2026 |
| 10-year Treasury | 5.13% | October 21, 2026 close |
| Prime rate | 7.00% | October 2026 |
| SBA 504, 25-year effective rate | 6.97% | October 8, 2026 debenture sale |
That’s the raw material. Heres what Sacramento borrowers are seeing on term sheets this month, by lender type:
| Loan type | Indicative rate, October 2026 | Typical leverage | Best fit in Sacramento |
|---|---|---|---|
| Fannie Mae / Freddie Mac multifamily, 5–10 year fixed | About 6.35%–7.10% | Up to 65%–75% LTV | Stabilized apartments, Natomas to Roseville |
| Life company, 10-year fixed | About 6.50%–7.15% | 55%–60% LTV | Low-leverage industrial, grocery-anchored retail |
| Bank or credit union, 5-year fixed | About 6.60%–7.60% | 60%–70% LTV | Owner-users, local investors with deposits |
| CMBS, 10-year fixed | About 7.10%–7.90% | Up to 70%–75% LTV | Larger stabilized assets, non-recourse |
| Bridge, floating (SOFR + 3.25%–5.50%) | About 7.10%–9.40% | Up to 75%–80% of cost | Office lease-up, value-add apartments |
| Hard money | About 10.00%–12.50% | 50%–65% LTV | Speed, rehab, credit or title problems |
Ranges are Financial Compound estimates based on the 10-year Treasury near 5.1% and current spreads by lender type. Your rate depends on the asset, the sponsor and the leverage.
Two things worth knowing. First, futures traders were pricing high odds of another Fed hike in December as of early October, and the FOMC meets again October 28. Second, fixed-rate permanent money is priced off the 10-year, not the Fed. So even if the Fed holds, your 10-year fixed can still move a quarter point in a week. For a deeper look at how each of these gets built, see how commercial mortgage rates are priced.
Sacramento Commercial Real Estate Market at a Glance: Q3 2026
Heres the one-table version. All four sectors use Kidder Mathews’ third-quarter research, so the numbers are apples-to-apples.
| Sector | Vacancy | Average asking rent | Q3 net absorption | Direction |
|---|---|---|---|---|
| Office | 11.0% direct | $2.15/SF/mo full service | −36,593 SF | Flat |
| Industrial | 6.1% direct | $0.80/SF/mo NNN | +347,711 SF | Improving |
| Multifamily | 6.1% | $1,807 per unit | +1,023 units | Improving |
| Retail | 5.9% | $1.55/SF/mo | +144,573 SF | Steady, tight |
Unemployment in the Sacramento-Roseville-Folsom metro was 5.2% in August, up from 4.2% in May but below the 5.4% of a year earlier. California sat at 5.1% and the nation at 4.1%. Not a boom. Not a bust either. A region with a big government and healthcare payroll underneath it, which is exactly why lenders still like it.
Sacramento Office: The Return-to-Office Test
Everybody wanted the state’s return-to-office order to rescue downtown. The early read is more modest. According to Kidder Mathews’ third-quarter office report, direct vacancy held at 11.0%, unchanged from the prior quarter and from a year ago. Net absorption was negative about 37,000 square feet, and Downtown itself gave back about 82,000. Asking rents averaged $2.15 per square foot per month full service, down 1.9% year over year.
Why didn’t four days a week fill buildings? Because the state has spent years consolidating agencies into buildings it owns. More bodies are downtown, sure. They’re just sitting in state-owned space, not signing private leases. That’s good for the sandwich shop on K Street. It’s less good for the landlord with a half-empty Class B building on Capitol Mall.
Why Sacramento Office Vacancy Depends on Whose Report You Read
Heres something that confuses a lot of borrowers, and appraisers too. CBRE’s third-quarter figures put Sacramento office vacancy at 18.0%. Kidder Mathews says 11.0%. Same market. Same quarter. Both right.
The difference is what each firm counts. CBRE tracks a narrower set of larger multi-tenant buildings, the kind institutional investors own, and that’s where the empty space is. Kidder counts a wider universe of about 105 million square feet, including smaller and owner-occupied buildings that are mostly full. CBRE did report a third straight quarter of positive absorption, about 65,000 square feet, which is the more encouraging signal. When your appraiser cites a vacancy number, ask which survey it came from. The answer moves your loan size.
Submarkets Lenders Like, and the Ones They Don’t
| Submarket | Direct vacancy | Avg. asking rent (FS) | Lender read |
|---|---|---|---|
| Elk Grove | 2.1% | $3.02 | Strong. Medical and service users. |
| Folsom | 8.1% | $2.45 | Good. Tech and healthcare tenants. |
| Midtown | 8.2% | $2.44 | Good for smaller, updated buildings. |
| Roseville/Rocklin | 9.3% | $2.21 | Good. Led all submarkets in Q3 leasing. |
| Downtown | 9.5% | $2.84 | Asset-specific. State tenancy cuts both ways. |
| Highway 50 Corridor | 16.6% | $1.79 | Cautious. Lower leverage. |
| Point West | 19.1% | $1.99 | Bridge or debt fund territory. |
| South Natomas | 23.9% | $2.19 | Hardest to finance in the region. |
One more split matters: building class. Class A direct vacancy was 13.7%, and Class B was 12.0%, while Class C was only 6.1%, and Class C actually absorbed space in Q3. Small tenants want cheap, functional space. The big floorplates are what’s sitting empty.
How Lenders Underwrite Sacramento Office in 2026
Office isn’t dead in Sacramento. It’s just underwritten one building at a time. Banks want leases that run past the loan’s maturity, rollover reserves, and debt yields north of 10%. Expect 55% to 60% leverage on a well-leased suburban building. Investment sales volume is up about 37% year to date, and the biggest trade of the quarter tells you where the money is going: a 42,000-square-foot Roseville building sold for $19 million, about $450 per foot. Compare that with a 100,000-square-foot building in West Sacramento that sold for about $110 per foot. Same metro, four times the price per foot. That’s the whole office market in one comparison.
If you own an office building with a loan maturing in the next 18 months and occupancy under 80%, don’t wait for the refinance to fail. Start the conversation now. We’ve walked borrowers through this exact situation in San Francisco, and the playbook in our San Francisco office loan workout guide applies here too, just at smaller dollar amounts. Our commercial loan workout team can tell you which path fits.
Sacramento Industrial: Absorption Is Back
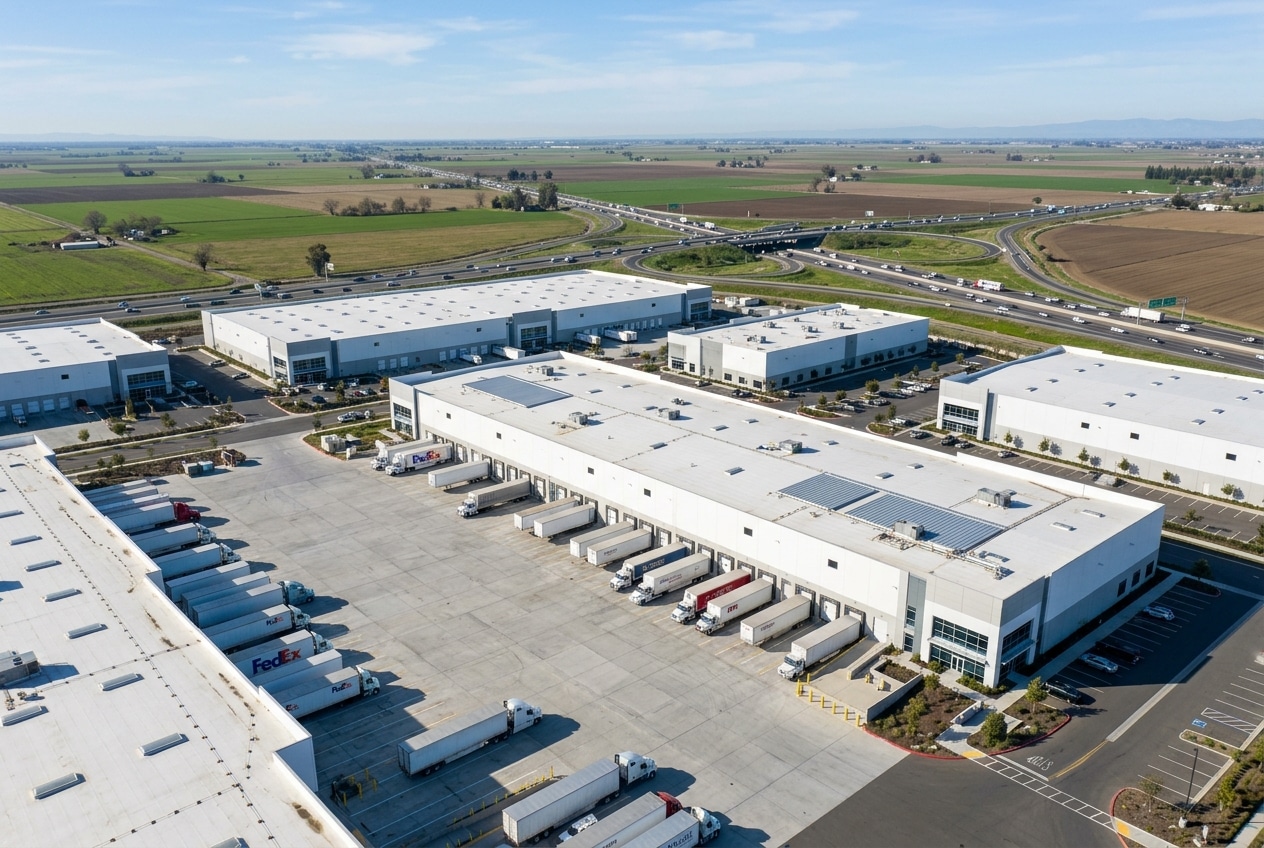
This is the good news. According to Kidder Mathews’ third-quarter industrial report, direct vacancy dropped to 6.1% across roughly 188 million square feet. Net absorption was a positive 347,711 square feet for the quarter. Year to date, absorption is nearly double what it was at this point in 2025. Asking rents ticked up to $0.80 per square foot NNN, the first increase after a soft stretch.
Investors noticed. About 3.9 million square feet traded in Q3, roughly $416 million in volume, more than triple the square footage that sold in Q2. The headline deal: North Market Business Center in Natomas, almost 1.9 million square feet, sold for $242.5 million, or about $128 per foot. And Grocery Outlet renewed 412,808 square feet in Power Inn. When the biggest tenant in a submarket re-ups, lenders sleep better.
Power Inn, McClellan and the Natomas Pipeline
Sacramento industrial isn’t one market either. Power Inn and McClellan are tight, at 4.5% and 3.7% direct vacancy. Davis/Woodland is at 3.7%. West Sacramento is the soft spot at 11.2%, after a run of large move-outs. Natomas/Northgate is where the new supply is going, including a 663,000-square-foot Costco distribution building due in the fourth quarter and a 558,000-square-foot logistics center due in 2027. About 1.6 million square feet is under construction in total, which is modest for a market this size.
Small-bay is the tightest product of all. Buildings between 4,000 and 50,000 square feet are running below 3% vacancy, according to local broker Peck CRE. That is exactly the space an owner-user wants to buy.
Financing Sacramento Industrial
Industrial is the easiest Sacramento property type to finance right now. Life companies will go 55% to 60% on stabilized, well-located warehouses at the lowest coupons on the menu. Banks will do 65% to 70% for local sponsors.
For owner-users, the SBA 504 is still the standout. The October debenture sale set the 25-year rate at 6.97%, with 10% down. We ran the full SBA 504 buy-vs-lease math for industrial owner-users last week for the Inland Empire. The structure works exactly the same way in Sacramento, and with Sacramento rents under the IE’s, the break-even year moves out a bit. Run it on your own building before you sign another five-year lease.
Sacramento Multifamily: Cap Rates Reset, Vacancy Falls
Sacramento built a lot of apartments in 2023 and 2024. That wave is finally getting absorbed. According to Kidder Mathews’ third-quarter multifamily data, vacancy fell to 6.1%, down 40 basis points from a year ago. The market absorbed 1,023 units in Q3 against only 248 new deliveries. Units under construction dropped 34% year over year. Average asking rent was $1,807 a unit, up less than 1%.
Now the part that matters for financing. The average cap rate jumped to 6.7%, up 120 basis points from 5.5% a year ago. Average price per unit also rose, on account of a few big, newer properties trading. The top deal was Talavera in Folsom’s Broadstone area, 293 units for $102.5 million, about $350,000 a door. Buyers are paying for quality and demanding real yield on everything else.
Why the Cap Rate Reset Matters for Your Loan Size
Heres the math nobody wants to do. Say you’re buying a $10 million apartment building at a 6.7% cap rate. That’s $670,000 of net operating income. Agency lenders typically want a 1.25x debt service coverage ratio. At a 6.6% rate on a 30-year amortization, that NOI supports a loan of about $7.0 million. Seventy percent leverage. Fine.
Now buy the same building at a 6.0% cap, which is where a lot of 2025 deals are priced. NOI drops to $600,000, and the same lender at the same rate will only lend about $6.3 million. Sixty-three percent. You need another $700,000 of equity, and you didn’t change anything except the price. In this market, the debt service coverage ratio sizes your loan, not the LTV. Our multifamily loan team runs that sizing before you go hard on a deposit, not after.
Rent Rules and What Lenders Underwrite
Most Sacramento apartments built more than 15 years ago fall under the state’s AB 1482 rent cap, and the City of Sacramento layers its own tenant protection program on top. Lenders underwrite in-place rents, period. If your business plan depends on pushing rents faster than those caps allow, the agencies won’t size to it. A value-add plan on a 1980s property usually starts on bridge financing and refinances into agency debt once the renovation premiums are real and seasoned.
Sacramento Retail: Quietly Tight
Retail gets the least attention and has some of the best numbers. Kidder Mathews’ third-quarter retail data puts vacancy at 5.9%, with asking rents of $1.55 per square foot, up about 4% year over year. Net absorption is about 400,000 square feet so far this year, compared with negative 39,000 at this point in 2025. Construction is down 65% from a year ago, so new supply isnt a threat.
The return-to-office order helps here more than it helps office. State workers buy lunch downtown four days a week now, not two. Grocery-anchored centers in Elk Grove, Roseville and Folsom finance about as easily as anything in the region. Auto dealerships and single-tenant net-lease buildings have been trading actively too. Average cap rates are around 6.7%, so the same coverage math as multifamily applies.
Where Sacramento Fits in the California Picture
We’ve written up every major California market this year, and Sacramento sits in an interesting spot. It doesn’t have Los Angeles’ office overhang. Our Los Angeles Q4 2026 market outlook covers that. It doesnt have the maturity wall the Bay Area is fighting through, which we laid out in Bay Area commercial mortgage maturities. Its industrial market is a fraction of the Inland Empire’s, but it’s tightening while the IE is still working through supply. And like San Diego’s industrial and medical office market, its strongest office demand comes from healthcare.
The short version: Sacramento is a middle-of-the-fairway California market. Lower rents, lower values, steadier demand. Lenders treat it as a secondary market, so spreads run a little wider than in LA or the Bay Area. Strong sponsors close that gap fast.
What This Means for Sacramento Borrowers in Q4 2026
- Refinancing a loan written in 2016 to 2021? Your new rate is likely 2 to 3 points higher than the old one. Order the appraisal early, and know your debt service coverage number before the lender tells you. Our commercial refinance team models that first.
- Own office with a near-term maturity? Get in front of it. An extension negotiated six months early is a very different conversation than one negotiated six days late.
- Industrial owner-user still leasing? Small-bay vacancy under 3% means rent leverage belongs to landlords. Price out a 504 purchase now.
- Buying apartments? Underwrite at today’s 6.7% cap environment and size the loan off coverage, not price. If the seller’s number only works at a 6.0% cap, walk.
- Need to close fast? A California bridge loan can take down the property while permanent financing gets lined up. Know the exit before you sign.
- Building? Construction lenders are selective but open to multifamily and industrial with real pre-leasing. See our construction loan financing page.
Frequently Asked Questions About the Sacramento Commercial Real Estate Market
What is the office vacancy rate in Sacramento in 2026?
Sacramento office direct vacancy was 11.0% in the third quarter of 2026, according to Kidder Mathews, unchanged from a year earlier. CBRE reported 18.0% for the same quarter because it tracks a narrower set of larger multi-tenant buildings. Downtown direct vacancy was 9.5%, while South Natomas was the weakest submarket at 23.9%.
Did the state return-to-office mandate help Sacramento commercial real estate?
It helped downtown retail and foot traffic more than office leasing. Most state workers returned four days a week starting July 1, 2026, and downtown foot traffic rose about 12% in the first ten days. Office vacancy held flat at 11.0% in Q3, partly because the state has consolidated agencies into buildings it owns.
What are commercial mortgage rates in Sacramento right now?
As of late October 2026, fixed-rate permanent loans on stabilized Sacramento properties are running roughly 6.35% to 7.90% depending on lender type, with agency multifamily and life company loans at the low end and CMBS at the high end. Floating-rate bridge loans run about 7.10% to 9.40%. The 10-year Treasury was 5.13%, and SOFR was 3.88%.
Is the Sacramento industrial market recovering?
Yes. Direct industrial vacancy fell to 6.1% in Q3 2026 with positive net absorption of about 348,000 square feet, and asking rents rose to $0.80 per square foot NNN. Investment sales volume was roughly $416 million in the quarter. West Sacramento remains the softest submarket at 11.2% vacancy.
What are multifamily cap rates in Sacramento?
The average Sacramento multifamily cap rate was 6.7% in Q3 2026, up 120 basis points from 5.5% a year earlier, according to Kidder Mathews. Vacancy fell to 6.1% and average asking rent was $1,807 per unit. Higher cap rates mean lenders size more loans on debt service coverage than on loan-to-value.
How much down payment do I need for a commercial property in Sacramento?
Most investors put down 25% to 40%, depending on the property type and the lender. Agency multifamily loans can reach 70% to 75% leverage when coverage allows, while office loans usually top out near 55% to 60%. Owner-users buying their own building with an SBA 504 loan can put down as little as 10%.
Do I need a commercial mortgage broker for a Sacramento loan?
You don’t need one, but a broker shops banks, credit unions, life companies, agencies, CMBS, and debt funds at the same time. In a secondary market like Sacramento, where spreads vary widely by lender, that comparison can save more than the broker fee. Financial Compound represents borrowers only and charges no upfront fees.
Talk to Financial Compound About Your Sacramento Deal
Whether it’s a refinance on a Roseville office building, a warehouse purchase in Power Inn or an apartment acquisition in Natomas, we’ll put every lender that fits your deal side by side so you see the real cost of capital. Financial Compound has placed over $6 billion in commercial debt and equity since 1996, and we represent borrowers only. Call Michael at (310) 260-5900 x3, email info@commercialmortgagebroker.org, or book a consultation online.